EarningsWatcher is not a standard, run-of-the-mill trading product. It packs research, scanning, simulation, backtesting, planning, journaling, paper trading, and a full options education program into a single workflow for trading volatility around earnings releases. Built for experienced traders; genuinely instructive for newer ones.
This review was conducted personally, hands-on, by our founder — who came away seriously impressed. The platform also holds a 4.8 / 5 rating on Trustpilot across a fast-growing member base of 1,500+, which lines up with what we found. Pricing runs $50/month, $480/year, or — unusually for a SaaS product in this category — $1,000 one-time for lifetime access. Pricing and features verified July 2026.
What is EarningsWatcher?
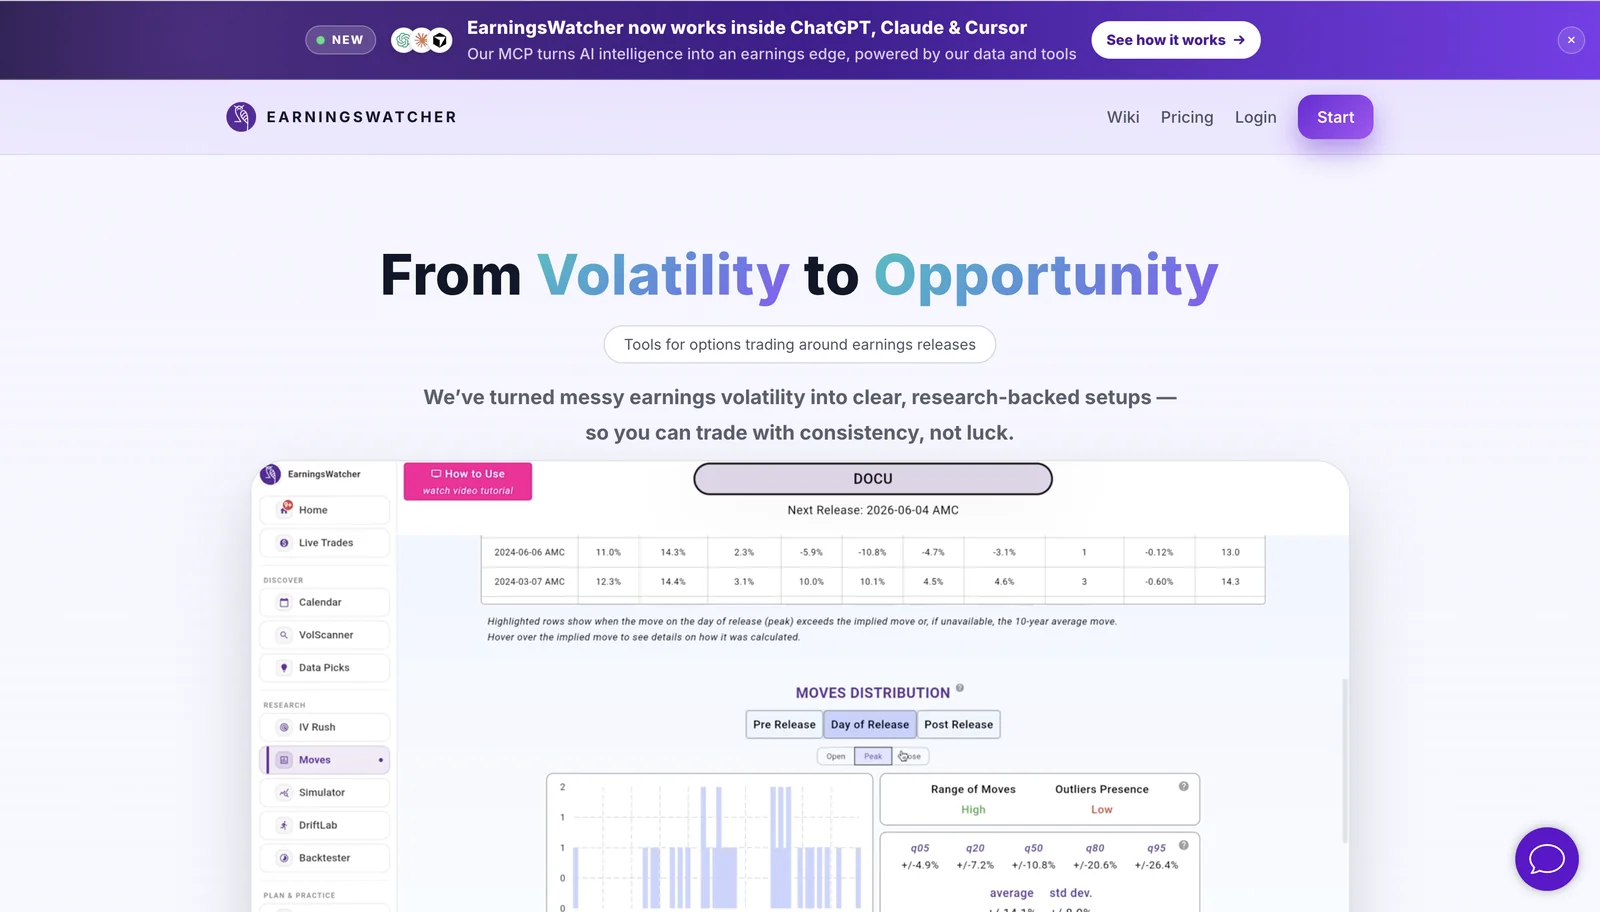
EarningsWatcher does one thing and does it deeply: options trading around earnings releases. The premise — "From Volatility to Opportunity" — is that earnings volatility follows measurable patterns. Implied volatility ramps into a report and collapses after it; some stocks routinely move more than options price in, others almost never do; many keep drifting for days after the reaction. The platform turns each of those patterns into a researched, repeatable setup, and it says so plainly on its own homepage: "Not a signal site. A process."
It's a read-only research and education platform — no brokerage connection required — covering US stocks and US-listed options. You research and structure trades here, then execute at your own broker. Built by founder Amin Khribi (the company is based in Paris), it has grown past 1,500 members and holds a 4.8/5 rating on Trustpilot.
The best way to understand why it's different is simply to walk through it, tab by tab. The app's sidebar is organized the way a disciplined earnings trader actually works — Discover, Research, Plan & Practice, Learn — and we spent hands-on time in every section.
The Home tab: a trading desk, not a dashboard
Log in and the Home tab immediately sets the tone. A welcome checklist tracks your progress through step-by-step strategy workflows — Getting Started, IV Rush, Long Vol, Short Vol, Momentum — so you're never staring at a wall of tools wondering where to begin, and an "Explore quests" button gamifies the early learning curve.
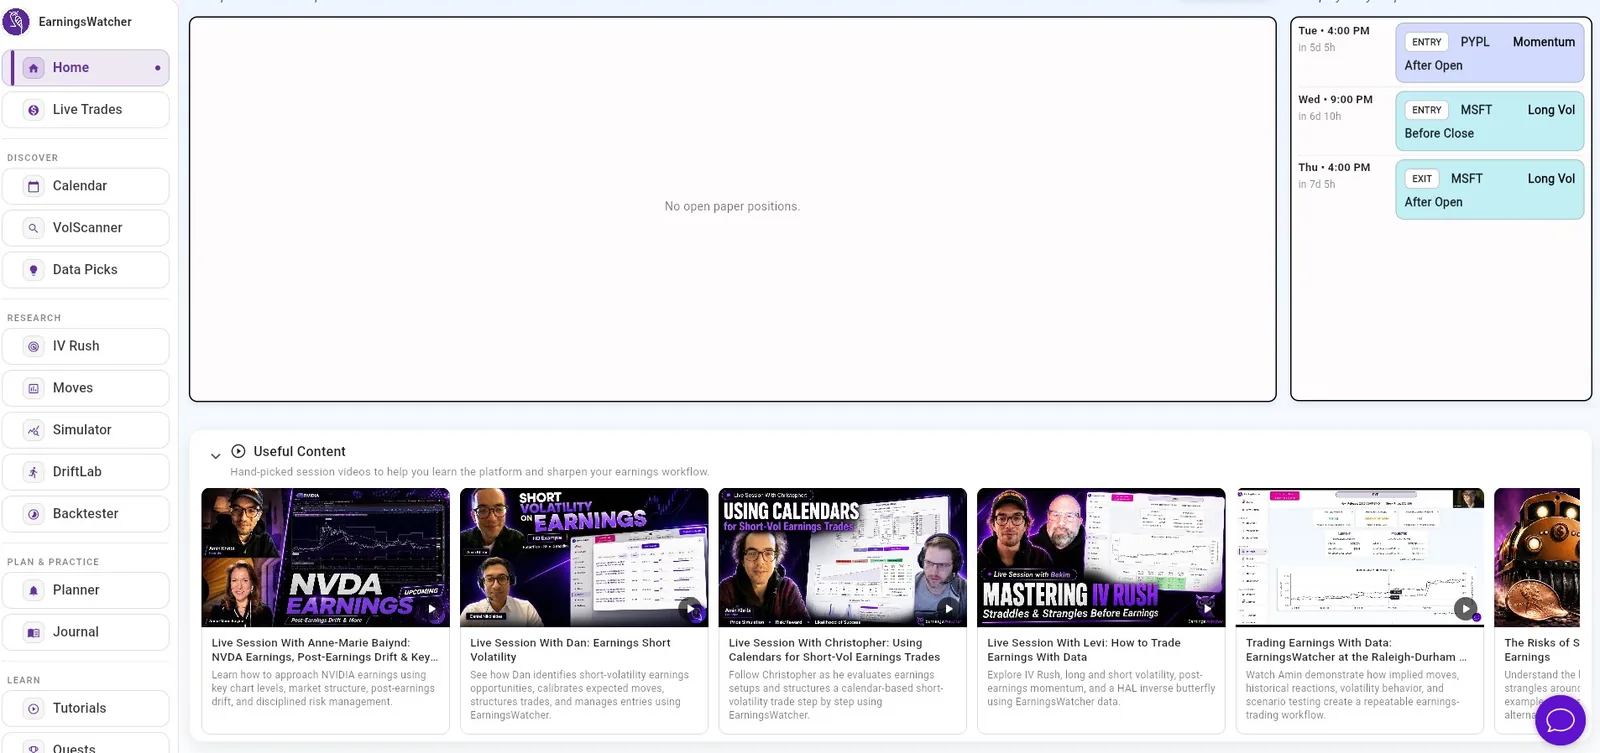
Below that sits the Daily Livestreams rail: the team hosts live sessions every day on Discord discussing the plays of the day, and the replays land right here — the day we looked, a recap of a GTLB long-vol setup flagged through the Calendar because it was pricing an unusually high ~21% move, alongside a weekly recap showing a worked CRM example position up 24.69%. Your paper-trading stats are front and center (our test account showed 113 trades, a 60% win rate, $131k in virtual cash, and a leaderboard rank), with open paper positions and a Coming Up panel that pulls entries and exits straight from your planner — e.g., "Wed 9:00 PM — MSFT Long Vol entry, before close; Thu — MSFT Long Vol exit, after open." A "Useful Content" shelf rounds it out with hand-picked session videos — live sessions with guest traders on NVDA earnings and post-earnings drift, short-volatility walkthroughs, calendar-spread structures, and trading earnings with data.
It's a small thing, but the Home tab is the product's thesis in miniature: learn, plan, practice, review — all in one loop.
Radar: the running watchlist across strategies
Sitting alongside Home is Radar — the platform's persistent watchlist across strategies. Once you're a few days in, Radar becomes the single screen you check first every morning: which of the setups you've flagged are still in range, which have already moved through their entry window, and which are about to activate. It's a small piece of surface area for a big amount of workflow — it means the trader isn't cross-referencing four tabs to remember what they were watching.
Calendar: the earnings calendar, rebuilt for volatility traders
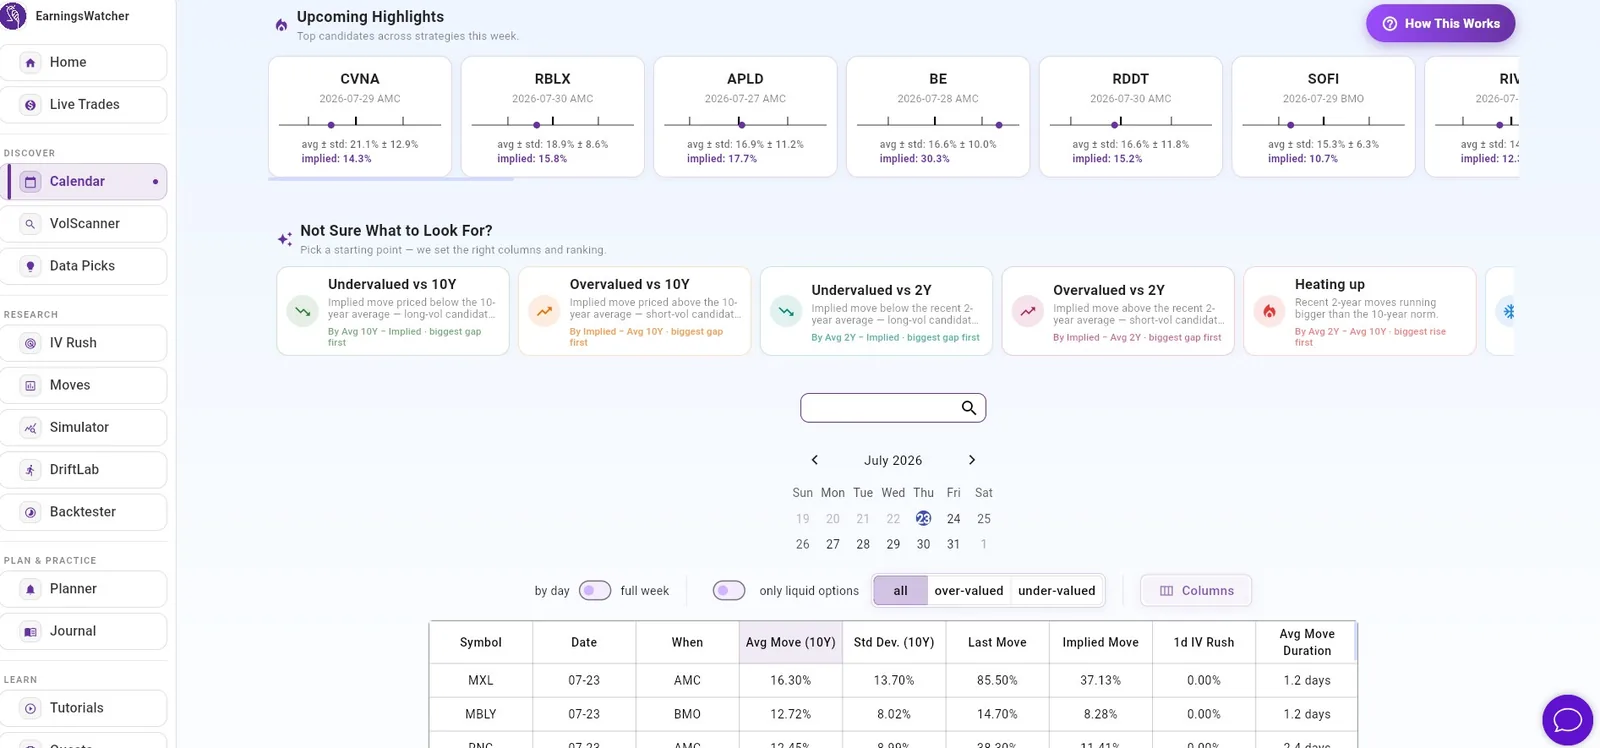
Every earnings calendar tells you who reports when. EarningsWatcher's Calendar tells you which reports are mispriced. Upcoming Highlights cards lead with the numbers that matter: CVNA reporting 07-29 AMC with a 10-year average move of 21.1% (±12.9%) against an implied move of just 14.3%; BE with an implied move of 30.3%; RBLX at 18.9% average versus 15.8% implied. In one glance you can see where options look cheap or rich relative to history.
Guided presets — Undervalued vs 10Y, Overvalued vs 10Y, the same versus the recent 2-year window, and Heating Up (recent moves running hotter than the long-term norm) — set the right columns and ranking for you. A full-week or by-day view, an "only liquid options" toggle, and a sortable table (average move, standard deviation, last move, implied move, IV rush, average move duration) turn a week of hundreds of reporters into a shortlist in minutes.
VolScanner: from ticker list to actual positions
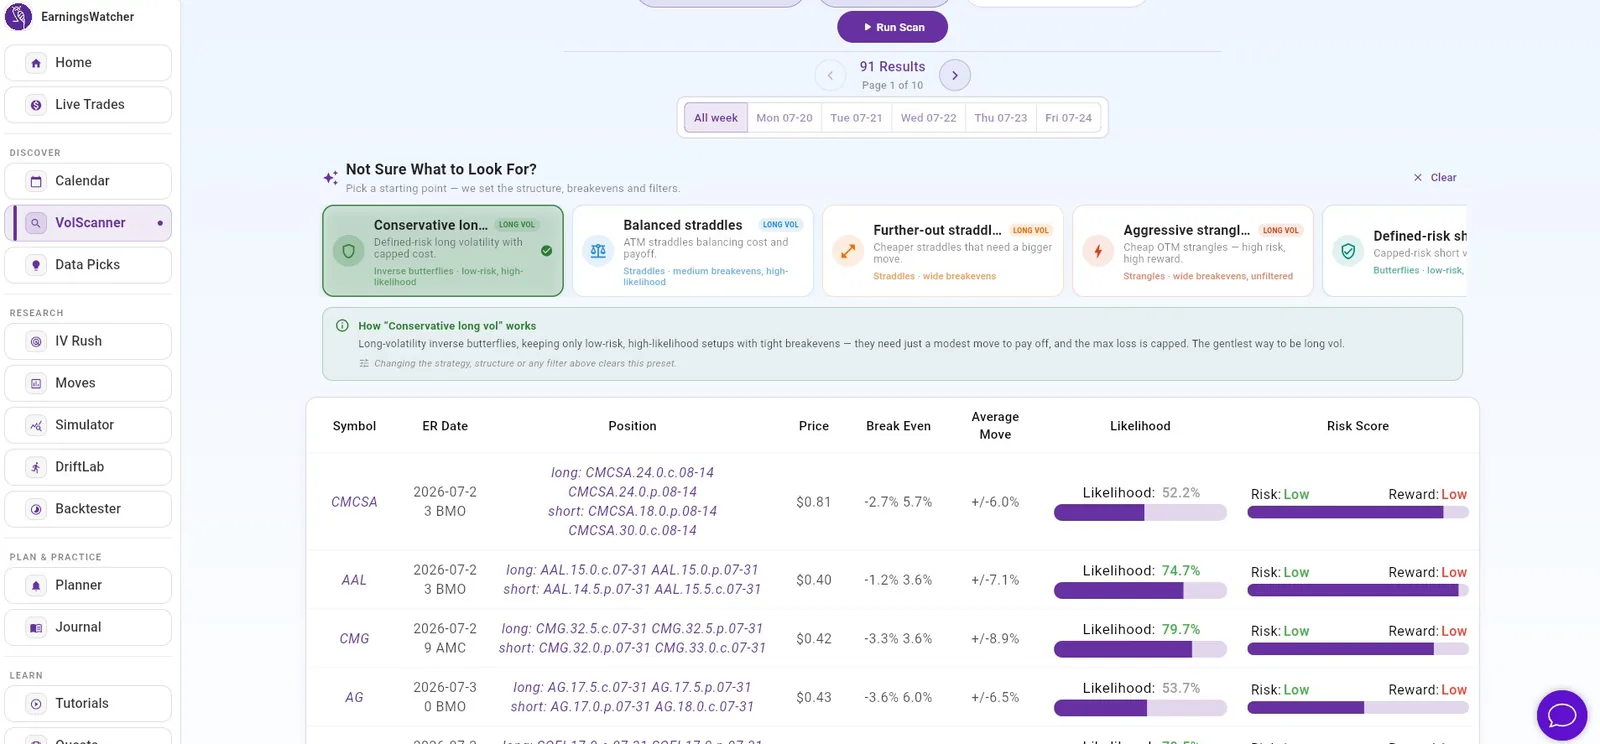
The scanner is where the platform stops resembling anything run-of-the-mill. Scanning the week we tested returned 91 candidate setups — and not as tickers, but as concrete, multi-leg positions with real strikes and expirations. A CMCSA inverse butterfly at $0.81 with breakevens at -2.7%/+5.7% against an average move of ±6.0%, likelihood 52.2%. An AAL structure at $0.40 with a 74.7% likelihood. A CMG setup at 79.7%. Each row carries breakevens, the stock's average move, a likelihood percentage, and separate risk and reward scores.
For anyone not sure where to start, preset strategy cards — Conservative long vol (defined-risk inverse butterflies, low-risk/high-likelihood), Balanced straddles, Further-out straddles, Aggressive strangles (cheap OTM, high risk/high reward), and Defined-risk short vol (capped-risk butterflies) — configure the structure, breakevens, and filters for you, each with a plain-language explainer box describing exactly how the preset works and what it's for. This is characteristic of the whole platform: every piece of functionality ships with its own instructions.
Data Picks: the models' shortlist, with honest numbers
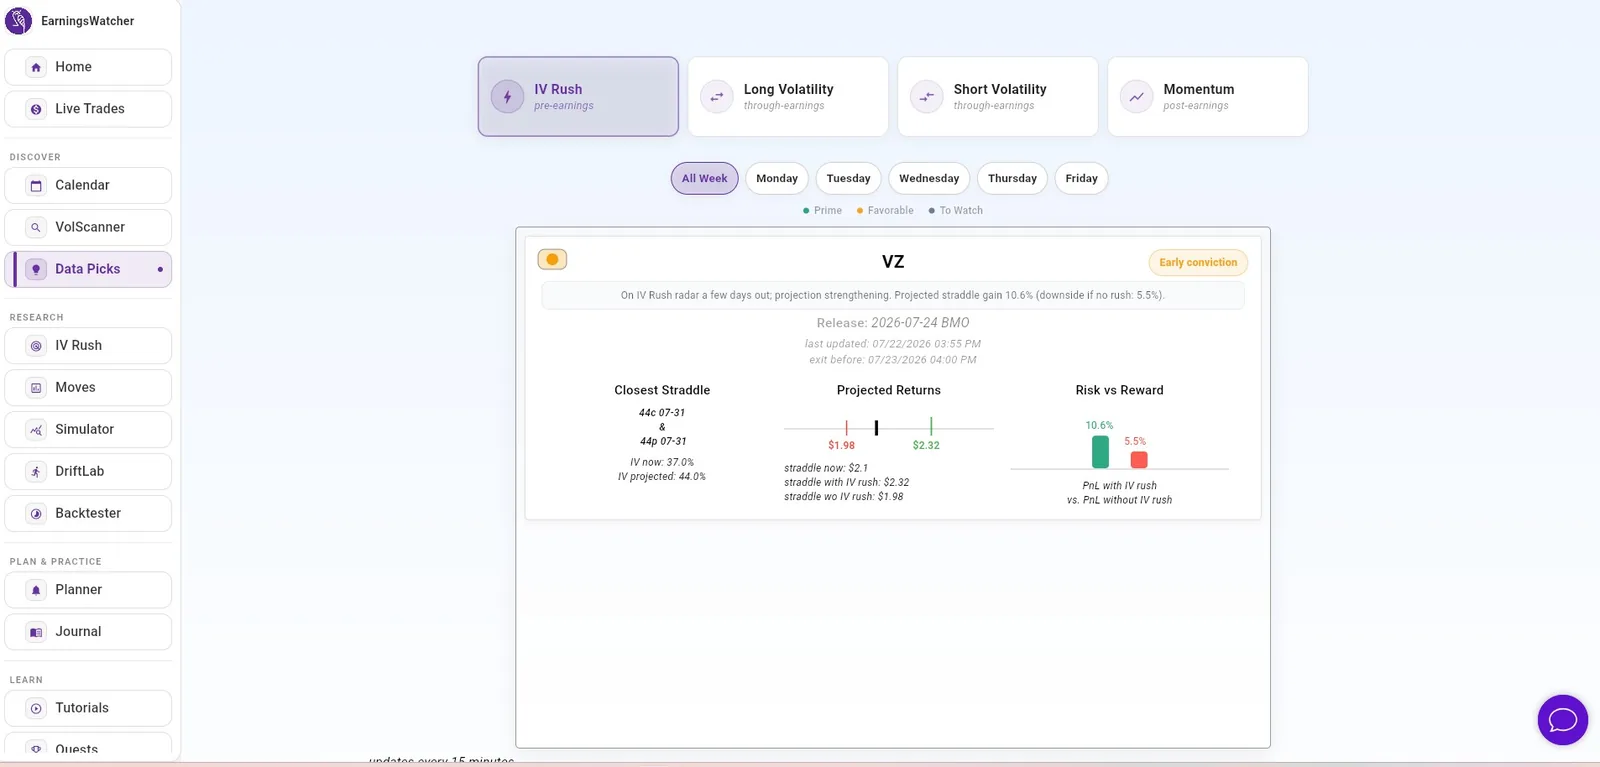
Data Picks is the curated layer: the team's statistical models surface a handful of setups per strategy — tabs for IV Rush (pre-earnings), Long Volatility and Short Volatility (through earnings), and Momentum (post-earnings) — tagged Prime, Favorable, or To Watch. What impressed us is the honesty of the presentation. A VZ pick labeled "Early conviction" showed the exact straddle (44c/44p 07-31), IV now versus projected (37.0% → 44.0%), the projected straddle gain with the IV rush (10.6%) and the downside if the rush doesn't materialize (5.5%), plus explicit timing: release 07-24 BMO, exit before 07-23 4:00 PM. Both sides of the bet, quantified, with a deadline. Picks update every 15 minutes.
IV Rush: the pre-earnings volatility ramp, quantified
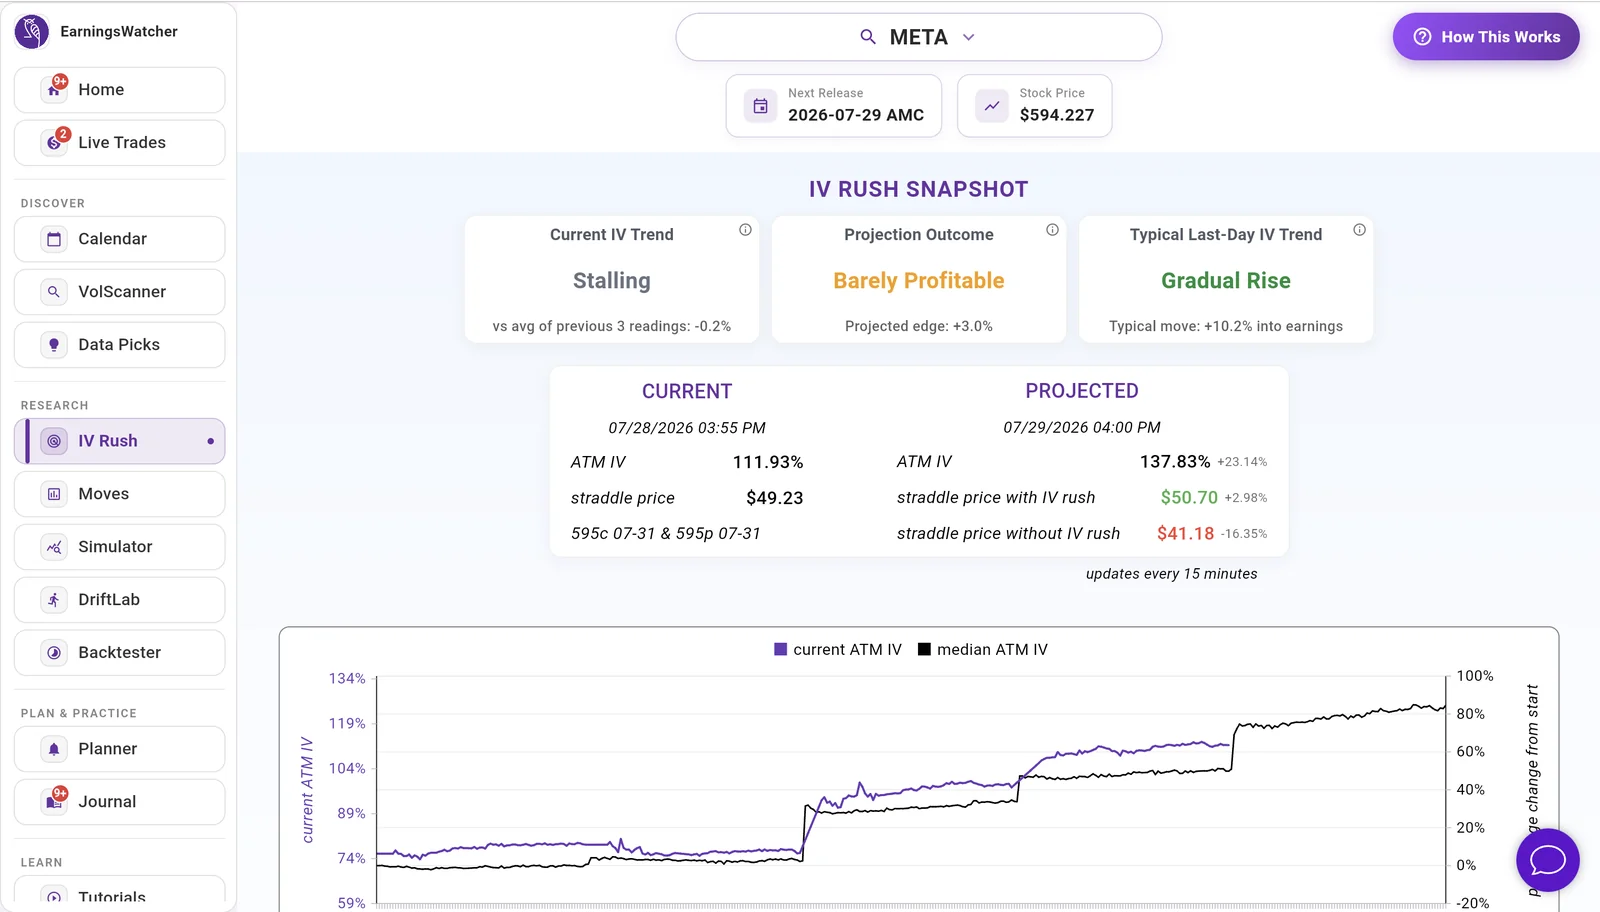
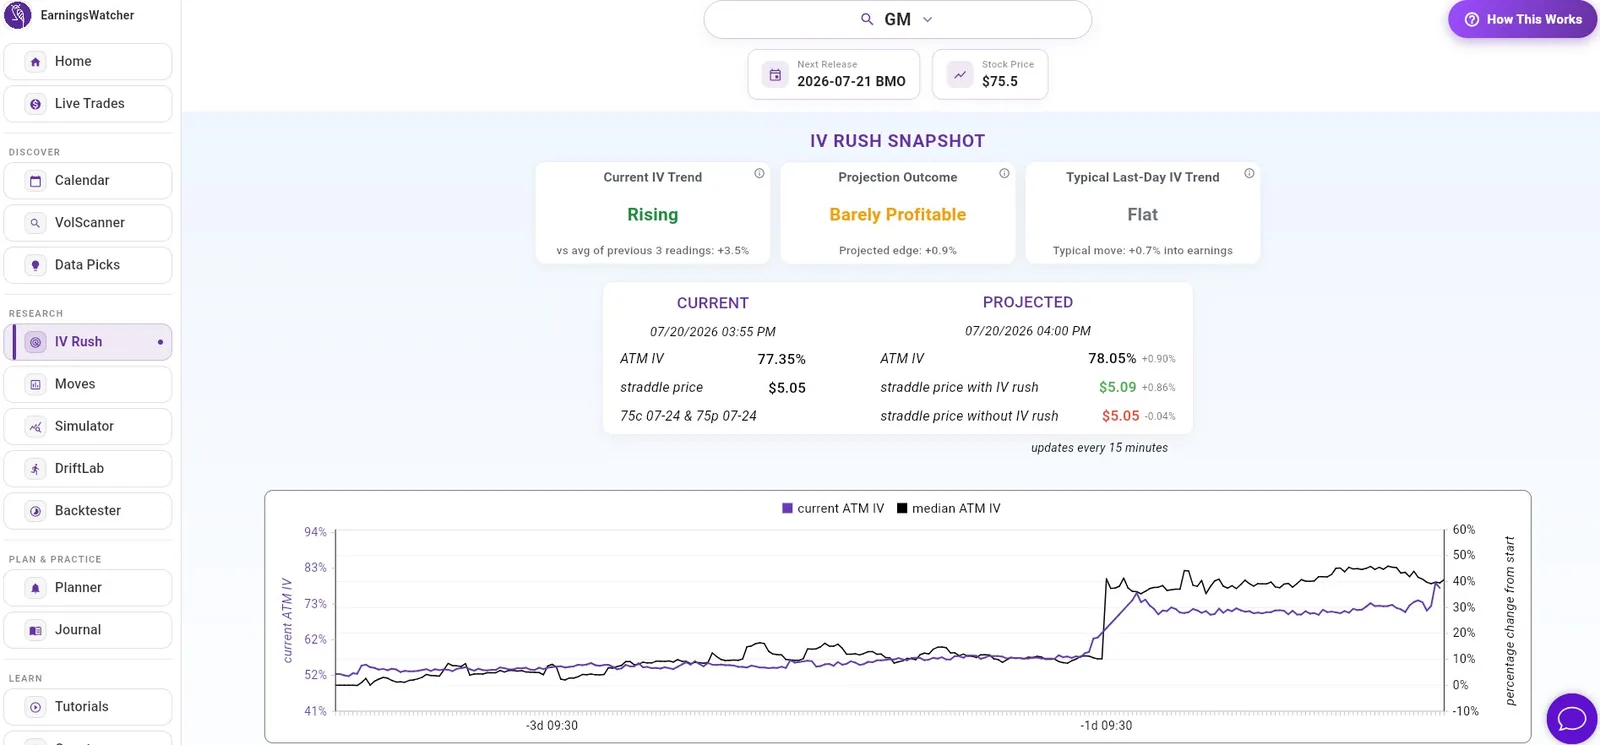
The platform's signature research module tracks how implied volatility builds in the final days before a report — the "IV rush" you can potentially harvest without ever holding through the announcement. Pull up a ticker (we looked at META, one day before its 07-29 AMC release) and the snapshot answers the only question that matters: is there still juice? Current IV trend: Stalling, -0.2% versus the average of the previous three readings. Projection outcome: "Barely Profitable," projected edge +3.0%. Typical last-day IV trend for this name: Gradual Rise (typical move +10.2% into earnings). Below, the ATM straddle (595c/595p, exp 07-31) priced now ($49.23) versus projected with the rush ($50.70, +2.98%) and without it ($41.18, -16.35%), and a chart of the current ATM IV path overlaid on the stock's median historical IV path into earnings. Updates every 15 minutes. The verdict here was, effectively, "the upside if the rush materialises is tiny (+3%) and the downside if it doesn't is meaningful (-16%)" — and a tool willing to tell you not to trade is worth listening to when it says the opposite.
Moves: a decade of earnings history on one screen
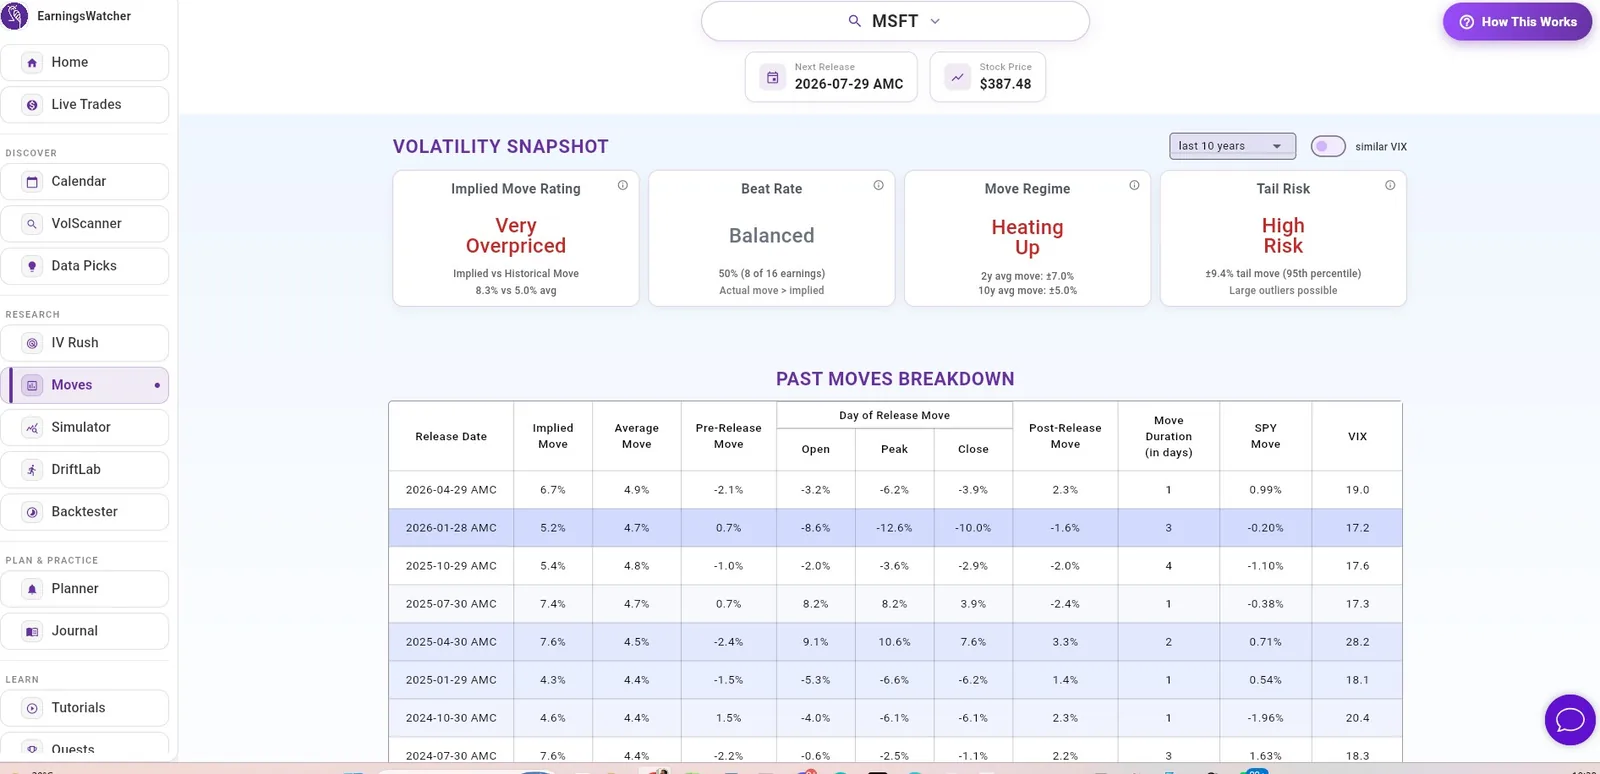
Moves is the statistical backbone. Under a four-cell snapshot at the top sits the table serious traders will live in: every earnings release for the past decade with implied versus average move, pre-release move, day-of open/peak/close, post-release drift and how many days it lasted, with SPY and VIX context for every event — and a "similar VIX" toggle to compare only against comparable market regimes. This is spreadsheet work that used to take years to accumulate, available per-ticker on demand.
Volatility Snapshot: a ticker's earnings character in four cells
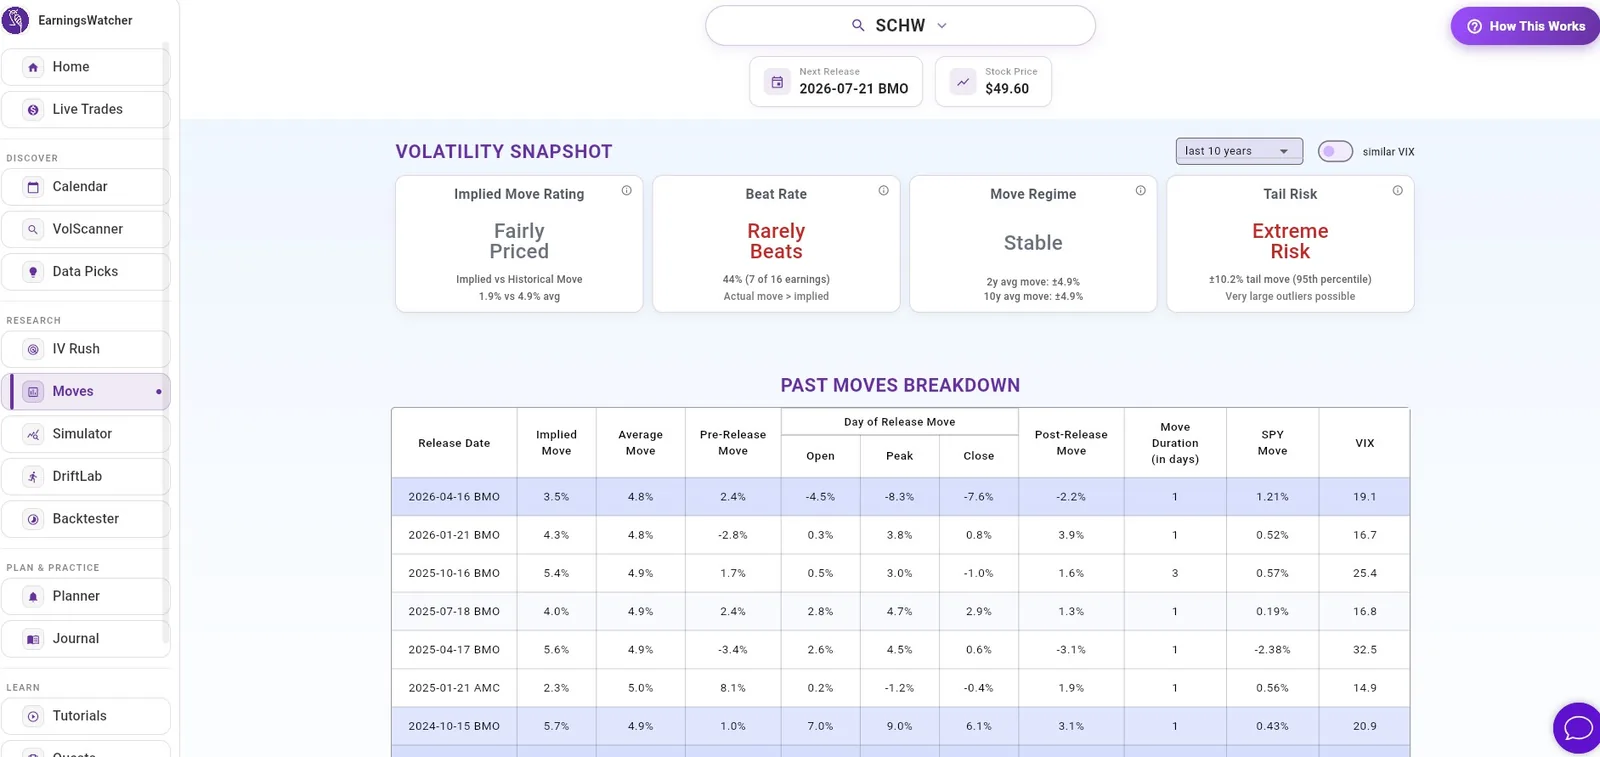
The Volatility Snapshot is the piece of the Moves tab we ended up looking at first, every single time. It compresses a ticker's entire earnings character into four cells. For MSFT ahead of its 07-29 report: Implied Move Rating "Very Overpriced" (options pricing 8.3% versus a 5.0% average move); Beat Rate "Balanced" (actual move exceeded implied in 8 of the last 16 reports); Move Regime "Heating Up" (2-year average move ±7.0% versus ±5.0% over 10 years); Tail Risk "High" (±9.4% at the 95th percentile). Run SCHW through the same lens and you get a completely different profile: fairly priced, "Rarely Beats" (44%), stable regime — but "Extreme" tail risk (±10.2%), a warning that this quiet name occasionally produces very large outliers. It's the fastest read on whether a name is worth building a position around at all.
Simulator: structure the trade, stress it, paper trade it
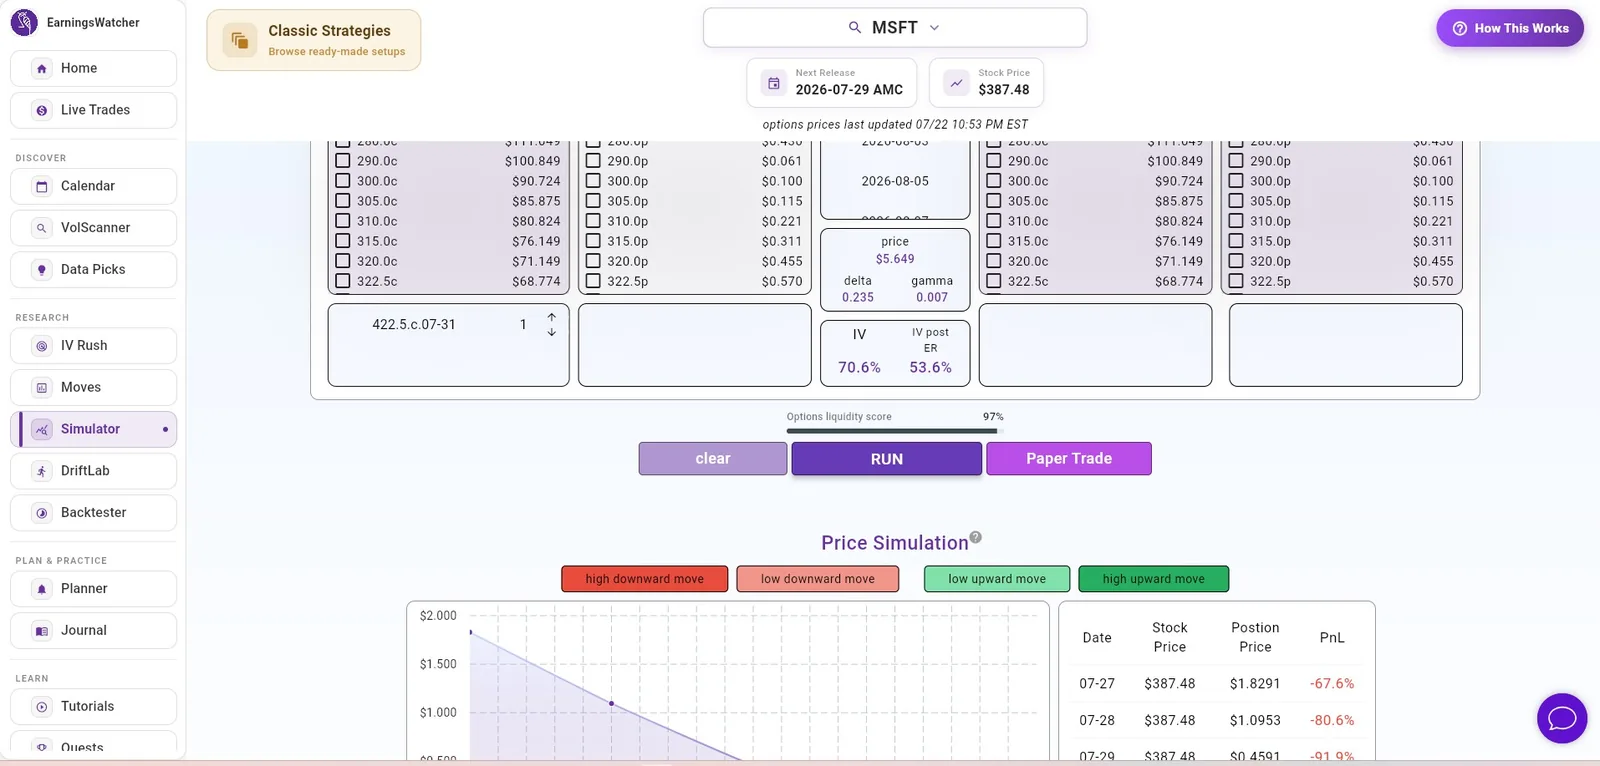
The Simulator is a full multi-leg builder on live option chains (prices timestamped; we saw a 97% options liquidity score on MSFT). Pick strikes and expirations across calls and puts, and each position shows its price, delta, gamma — and, critically, both IV now and estimated IV after earnings (70.6% → 53.6% on the MSFT chain we tested), so the IV-crush cost of holding through the event is never hidden from you.
Hit RUN and the Price Simulation engine plays your structure through four scenarios — high and low moves, up and down — with a payoff chart and a day-by-day P&L table. Our test position showed exactly what long premium into earnings looks like when the stock doesn't move: -67.6% by 07-27, -80.6% by 07-28, -91.9% by 07-29. Sobering, and precisely the point — this is where aspiring options buyers learn about risk before the market teaches them. A "Classic Strategies" library offers ready-made setups, and a single Paper Trade button sends any structure to your practice account.
DriftLab: quantifying post-earnings drift
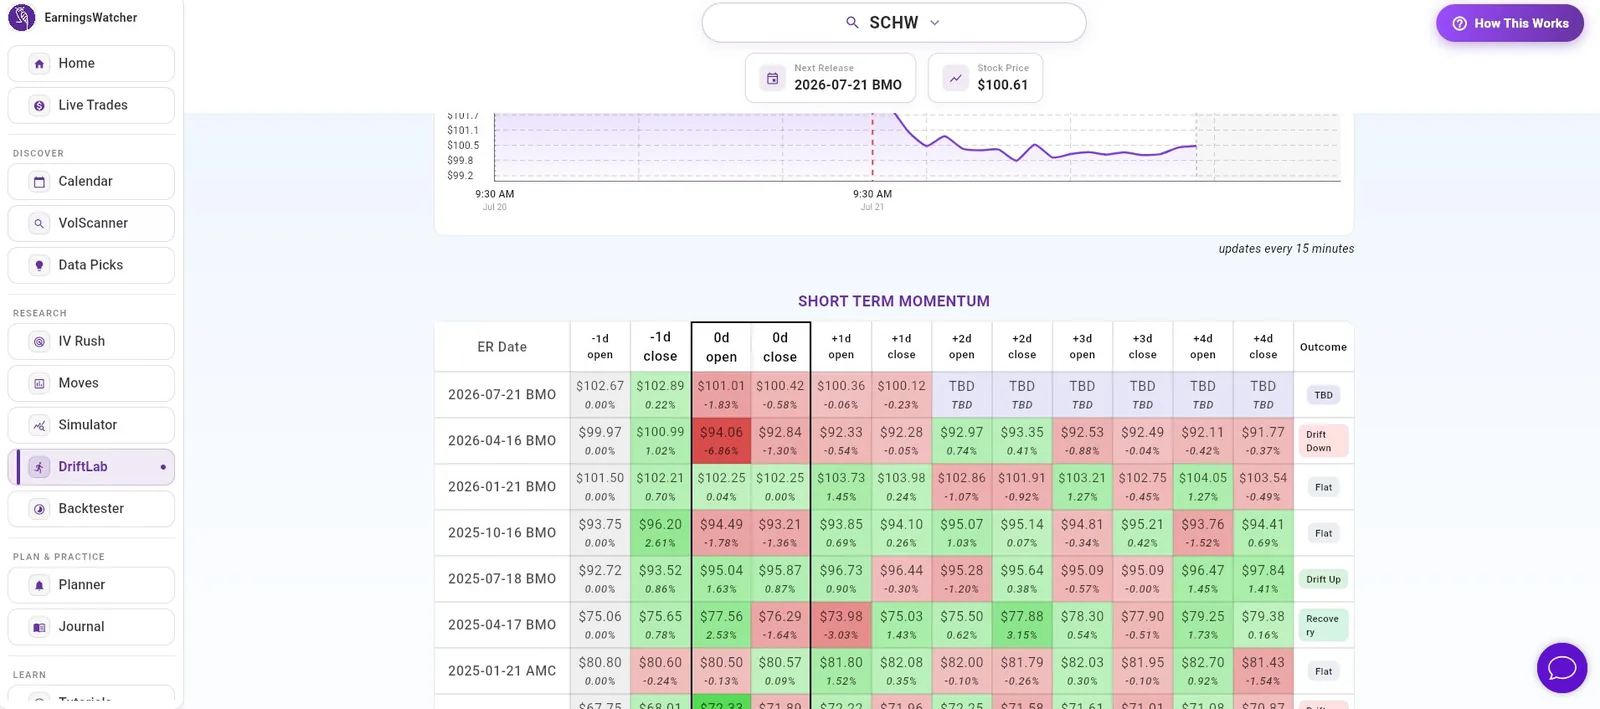
DriftLab is the Backtester's sibling module — it applies the same statistical treatment to post-earnings drift, the tendency of stocks to keep moving after the initial reaction once IV crush has cleared. This is a distinct, real edge from the pre-earnings volatility ramp: the drift is what feeds the platform's Momentum strategy, and DriftLab is the tool that measures whether a given name actually exhibits it and how long it typically lasts.
How DriftLab works: methodology, plainly explained
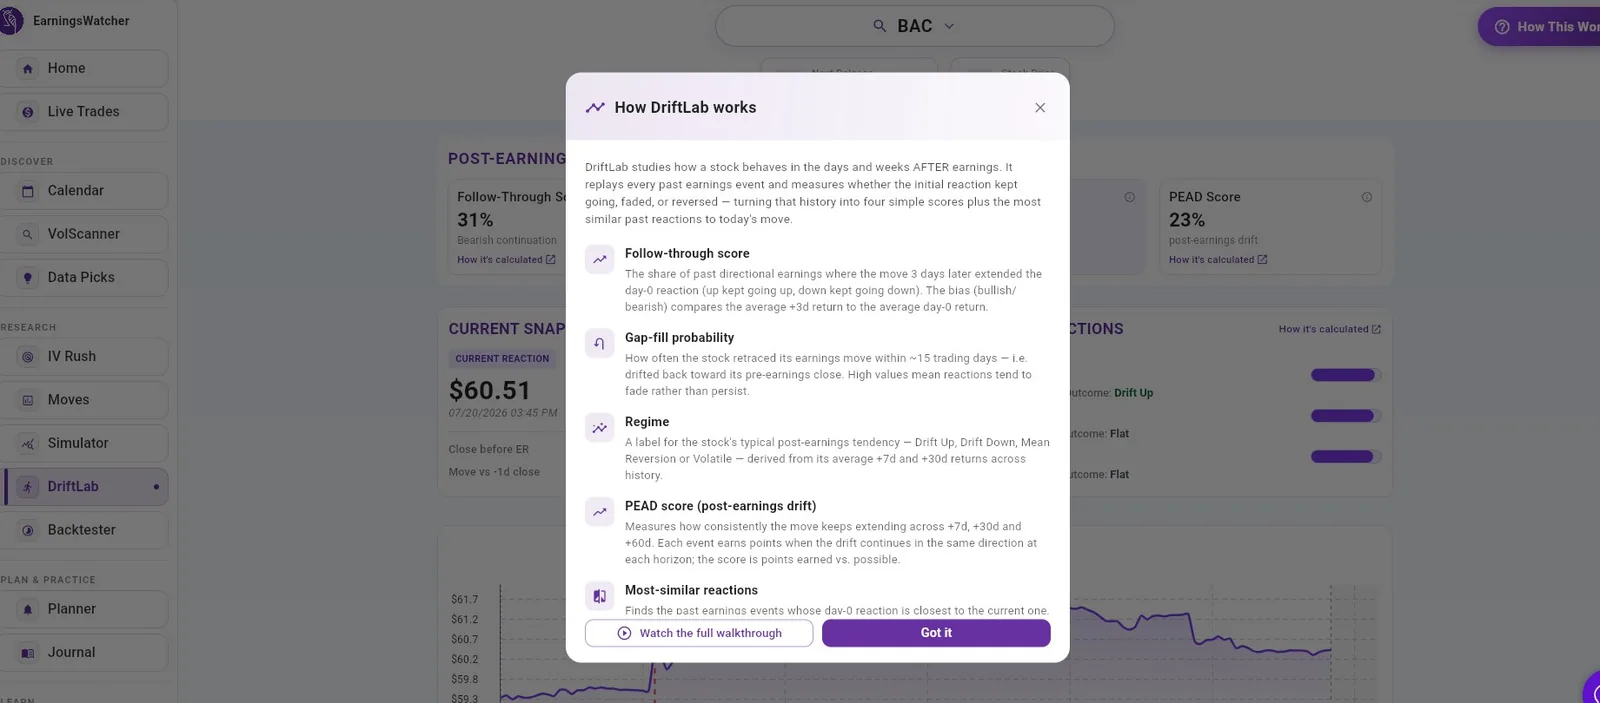
Like most tabs on EarningsWatcher, DriftLab ships with its own methodology explainer — a plain-language page that walks through exactly how the module counts a drift, what it excludes, and how it handles overlapping macro events. That level of transparency is characteristic of the whole platform: every piece of functionality carries its own instructions, and the "how it works" pages are one of the reasons this product doesn't feel like a black box.
Backtester: would this trade have worked?
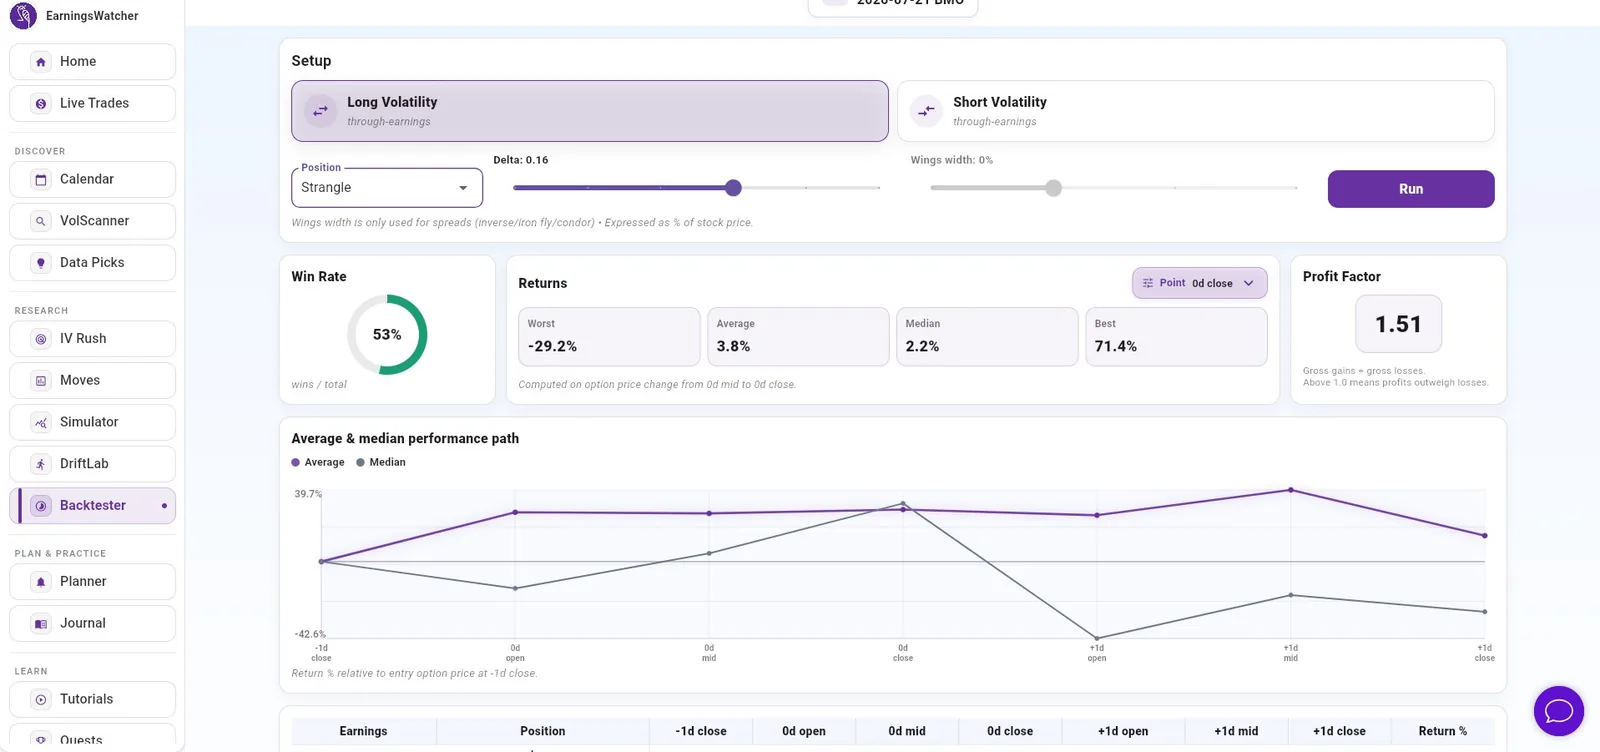
Before risking anything, the Backtester answers the historical question. Choose a ticker, a side (Long or Short Volatility through earnings), a structure (we tested a strangle), then tune delta and wing width with sliders. The output is a proper strategy report: win rate (53% on our test), a returns panel showing worst (-29.2%), average (+3.8%), median (+2.2%), and best (+71.4%) outcomes measured at your chosen exit point, and a profit factor (1.51 — gross gains versus gross losses). An average-and-median performance path charts how the position typically evolves from the day before to the day after the event, and a per-earnings table shows exactly how each historical report would have treated you at every checkpoint from -1d close to +1d close. The gap between that +3.8% average and +2.2% median — a distribution skewed by occasional big winners — is exactly the kind of insight that separates informed earnings trading from guessing.
Planner, Journal, and Live Trades: the process layer
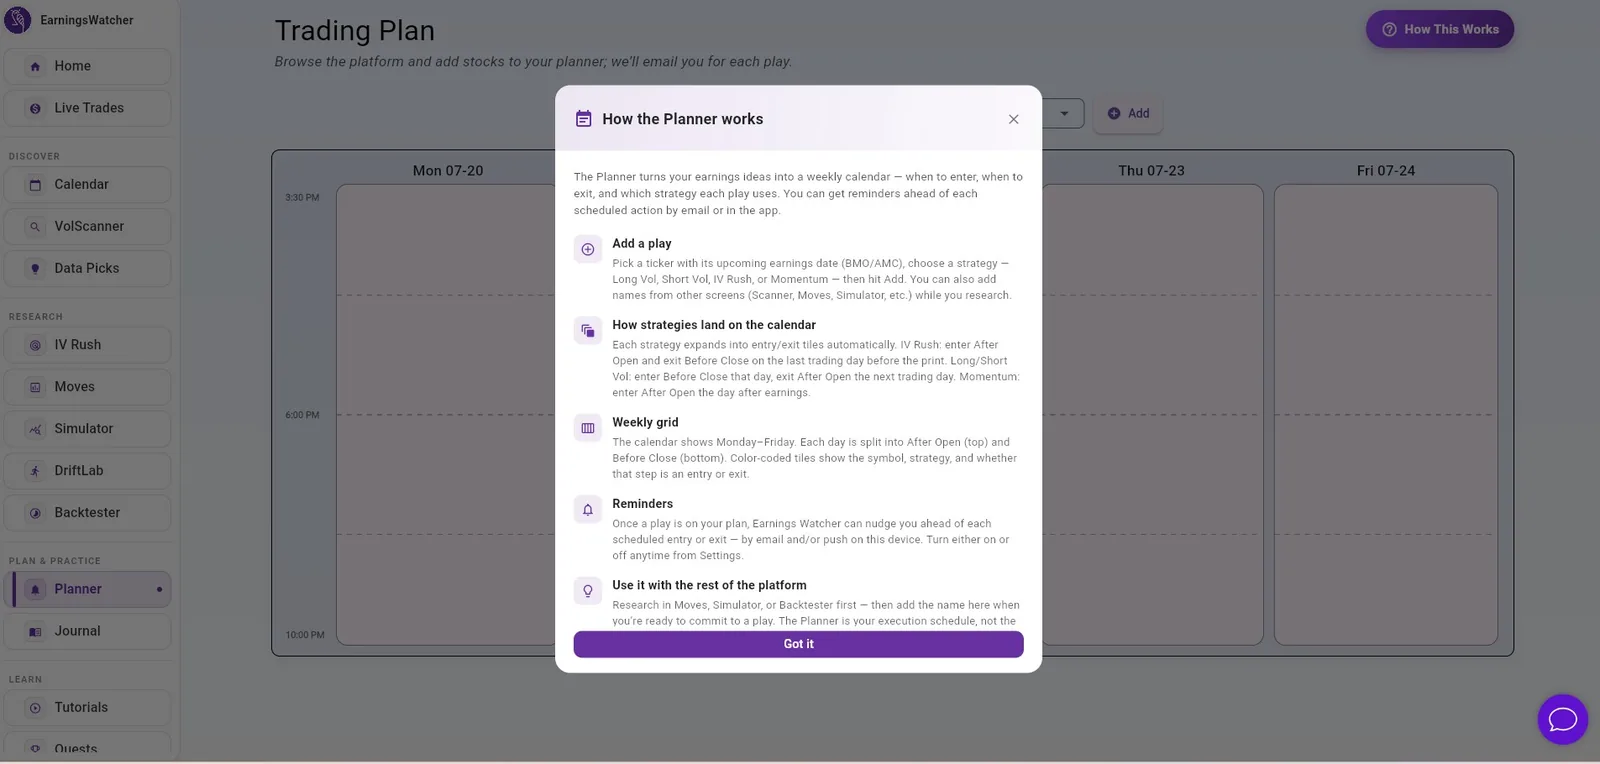
Three quieter tabs turn the research into a routine. The Planner schedules entries and exits around release timestamps (feeding the Home tab's Coming Up panel), the Journal records what you actually did and how it went, and Live Trades shows current activity on the platform. None of these is glamorous, but they're the difference between a stack of tools and a process — and most competing products don't bother with any of them.
Tutorials, Courses, and Quests: the education layer
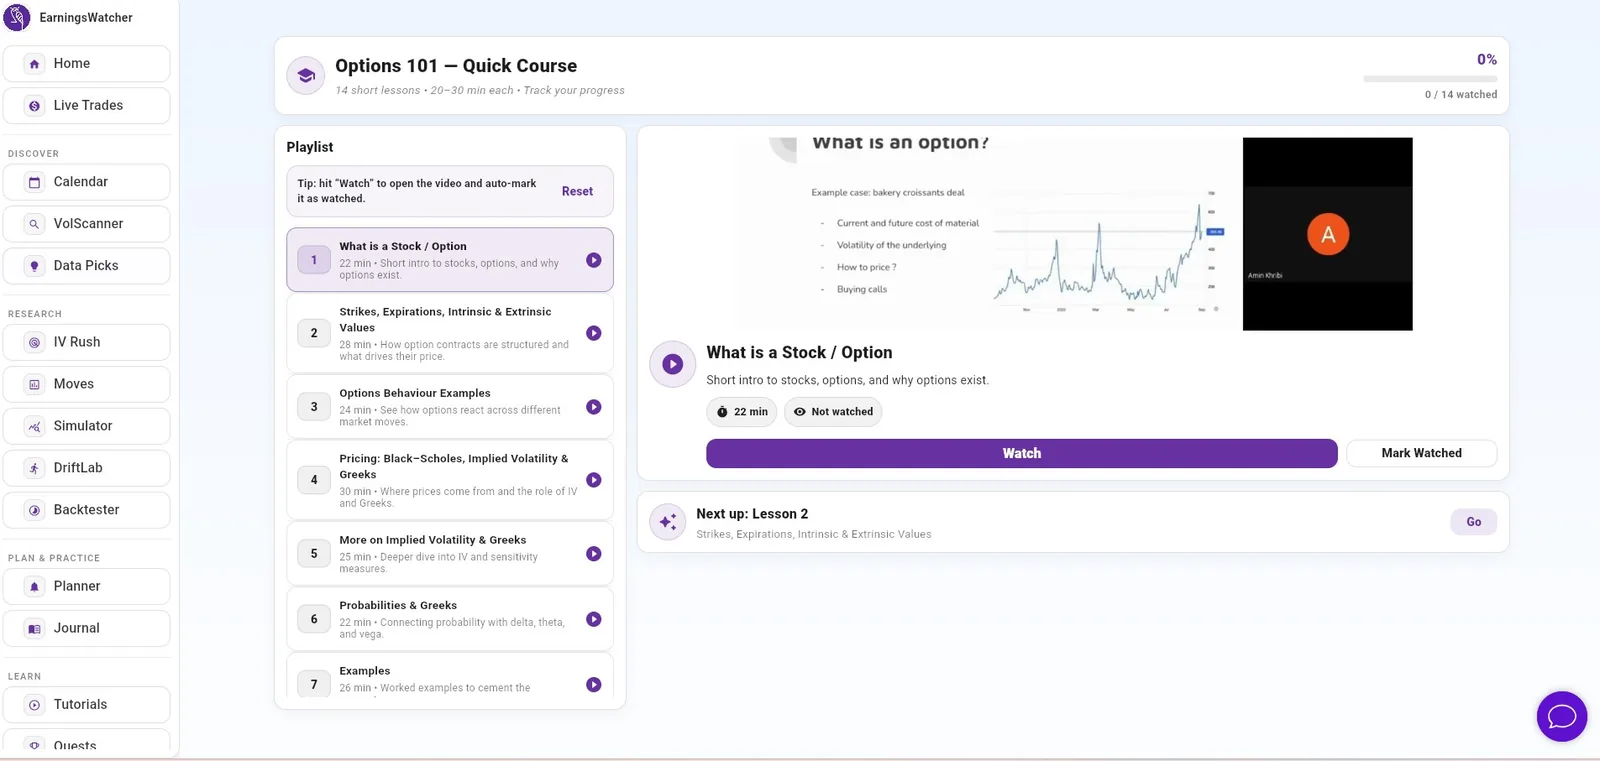
The Learn section is a real curriculum, not an afterthought. Options 101 — Quick Course is a structured video program (14 bite-sized lessons of 20–30 minutes, with progress tracking) taught by the founder, starting from "What is a Stock / Option" and building through strikes, expirations, intrinsic and extrinsic value, options behavior across market moves, Black–Scholes pricing, implied volatility and the Greeks, probabilities, and worked examples — before landing on the concepts the platform trades: IV rush and crush, long versus short volatility. Tutorials cover the platform's own tools, and Quests gamify the path from first login to first paper trade. There's a beginner channel in the Discord with weekly live help.
Outside the app, the free public wiki is substantial on its own: three levels of guides, free implied-move and IV-crush calculators, ticker-by-ticker earnings playbooks, cautionary studies ("Why 0DTE SPY calls lose," "Why selling calls is a trap"), a published methodology page, and — rare in this industry — transparently tracked scorecards of the platform's own strategies, winners and losers included (a 68-trade long/short-vol review and a 67-trade IV Rush recap at the time of writing).
API, MCP, and a Claude Connector: AI-ready by design
One more thing that separates EarningsWatcher from the pack: the data layer is open to you. Every plan includes API access (10+ endpoints) — and, unusually for a retail trading product, MCP access for AI assistants, including a Claude Connector. In practice that means you can plug EarningsWatcher's implied moves, IV paths, and earnings histories directly into Claude, ChatGPT, or Cursor and query them conversationally — "which of this week's reporters have overpriced implied moves and a high beat rate?" — or build your own automated research workflow on top. The wiki documents a real member doing exactly this: wiring the MCP into an AI-assisted pipeline that ran IV Rush research, placed an NFLX paper trade, and journaled the result. Most platforms at ten times the price haven't caught up to this yet.
Who is it for?
First and foremost, EarningsWatcher is built for experienced — even extremely experienced — options traders who want to trade the earnings cycle systematically. That's who will extract full value from decade-long move histories, regime and tail-risk context, and a backtester wired directly into trade construction. It suits serious retail traders with a day job (the IV Rush strategy in particular can be planned ahead and doesn't require watching the open), premium sellers who want defined-risk structures backed by statistics, and data-minded traders who will actually use the journal. API access on every plan, plus MCP access and a Claude Connector for AI-assisted workflows, extends it further for builders and AI-forward traders.
That said, it would be wrong to conclude that beginners and aspiring options buyers and sellers can't benefit — they can, meaningfully. Every tool carries its own instructions, the course assumes zero prior knowledge, and paper trading means the whole system can be learned without risking a cent. The education packed in here will do a great deal to steer newer traders and gives real insight into the different levels of risk across structures — from capped-risk butterflies to the account-ending tail risks the wiki warns about openly. The caveat stands: this is options trading around binary events; the platform labels everything "education, not advice" behind a prominent risk disclosure, and you should treat it that way.
Pricing
Three plans, all with identical full access: Monthly at $30 for the first month, then $50/month; Yearly at $480 (≈$40/month); Lifetime at $1,000 one-time. Every plan includes the full platform, the education program, daily livestreams, the Discord community, API access, and support. Payments run through Stripe/PayPal (cards, Apple Pay, Google Pay); cancel anytime.
Against a casual retail tool, $480–600/year is real money. Against what it replaces — an options analytics platform, an earnings-history database, a backtester, a paid course, and a trading community, each of which routinely costs this much alone (comparable analytics platforms like Market Chameleon or ORATS start around $99/month for less earnings-specific tooling) — it's competitively priced. The $30 first month plus paper trading amounts to a cheap, realistic trial.
The Lifetime plan at $1,000 is the option that stands out. Genuine lifetime pricing has all but disappeared from SaaS trading tools — most vendors have moved to recurring-only because recurring pays better. For an active earnings trader who intends to use this year after year, the math is straightforward: two years of the yearly plan already exceeds the lifetime price, and every year after that is free. It's a meaningful signal about how the founder thinks about long-term users — and, honestly, the reason we'd single this platform out even at a similar price point.
Our one marketing gripe: the sale-countdown banner on the pricing page feels pushier than a product this data-driven needs to be.
Overview and verdict
Walk back through the tabs and a shape emerges. The Calendar and VolScanner find the mispriced event. Moves and IV Rush quantify the edge. The Simulator structures the trade and shows what it costs to be wrong. The Backtester checks it against a decade of history. The Planner schedules it, paper trading rehearses it, the Journal records it — and the livestreams and Discord review it with you the same day. Every tab hands off to the next. That's what "a process, not a signal site" actually means in practice, and it's why this is not a standard, run-of-the-mill product.
It comes packed with features — backtesting, volatility scanners, planners, a proper trading journal — with instructions built into each piece of functionality. The statistical depth is the kind options traders used to build in personal spreadsheets over years, available here in a search box. And beyond the tooling, we'd hazard that this platform will teach a lot of people a great deal about trading options and volatility: the education woven through it steers newer traders in the right direction and gives genuine insight into the different levels of risk involved.
The honest warnings: it covers US markets only, it demands real engagement to justify $480+ a year, and no toolkit removes the risk of trading binary events — treat glowing "easy money" testimonials with the same skepticism the platform's own risk disclosure encourages. Its natural home is with experienced traders; but judged as what it is — a research, training, and process platform for earnings-options trading — it's the most complete offering we've reviewed, and the included education plus paper trading means beginners and aspiring options buyers and sellers can grow into it rather than being shut out.
Our founder put the platform through its paces personally for this review, and came away seriously impressed — it's rare that a niche tool survives hands-on scrutiny this well.
Rating: 4.5 / 5 — Highly recommended for options traders who want to trade earnings season with a process instead of a hunch.
Pricing and features verified July 2026. EarningsWatcher is a research and education platform; nothing on it (or in this review) is financial advice. Trading options around earnings involves substantial risk.